Jev makes structured decisions. A simple multiway interval tree turns those decisions into numerical outputs. No fine-tuning, no extra regression head: choose an interval, zoom in, repeat.
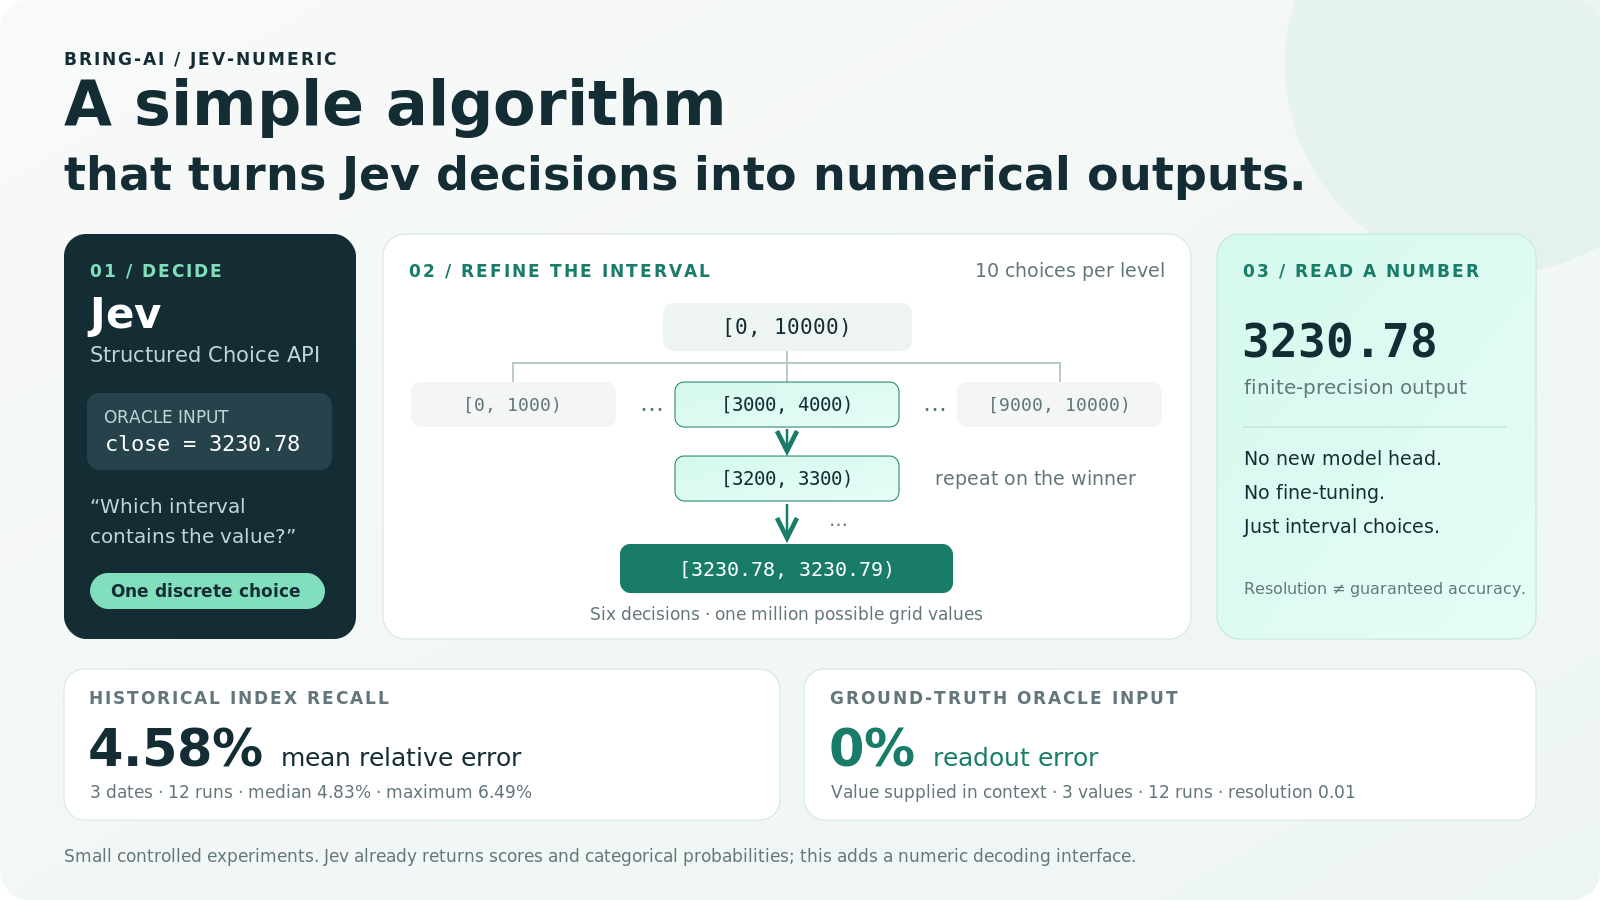
Turning Jev to Numerical Output
Here are three recorded runs:
- What is 1 + 1? → 2.00
- A stock costs USD 10 and rises by USD 1. → 11.00
- A stock costs USD 10.50 and rises by USD 1.25. → 11.75
Each used the same range, [0, 100), and 0.01 resolution. Four ten-way decisions produced each answer. The input contained the question; it did not contain the answer.
The adapter accepts JSON shaped like Jev's interface:
{
  "model": "typesafe/jev-1.13-20260917",
  "state": "A stock costs USD 10. It rises by USD 1.",
  "questions": {
    "new_price": {
      "type": "number",
      "instructions": "What is the new stock price in USD?",
      "range": [0, 100],
      "resolution": 0.01
    }
  }
}
The recorded response:
{
  "model": "typesafe/jev-1.13-20260917",
  "answers": {
    "new_price": {
      "type": "number",
      "value": 11.0
    }
  }
}
number is our adapter's type. Underneath, Jev receives ordinary Choice questions. Jev already provides option probabilities and rubric scores; our addition is an interface for decoding a target number at a requested resolution.
Split. Choose. Zoom in.
Start with a range that contains the answer. Split it into several non-overlapping intervals. Ask Jev which interval contains the value, then repeat inside the selected interval.
For a supplied value of 3230.78, the recorded ten-way path was:
[0, 10000)
  → [3000, 4000)
  → [3200, 3300)
  → [3230, 3240)
  → [3230, 3231)
  → [3230.7, 3230.8)
  → [3230.78, 3230.79)

Numerical output: 3230.78
Six decisions distinguish one million possible grid values. With N grid cells and K branches, the maximum depth is ceil(log_K N). The decoder returns the final cell's lower endpoint.
This describes the number of values the tree can represent. Accuracy still depends on Jev's choices. The caller supplies the range and resolution; an early wrong branch cannot be recovered by this greedy decoder.
How close are the numbers?
We measured the numerical gap using absolute relative error:
relative error (%) = 100 × |output − reference| / |reference|For historical recall, we asked for the S&P 500 price index's official close on the final trading day of 2019, 2020, and 2023. The verified closes were 3230.78, 3756.07, and 4769.83, respectively. Jev received the index and date, without the closing value or a retrieval tool supplied by us. The reference values came from FRED, with contemporaneous sources documented in the repository.
Each date had two option orders and two repeats: twelve runs, three unique dates. Every run used ten-way decoding over [0, 10000) down to 0.01 points.
- Mean relative error: 4.58%.
- Median relative error: 4.83%.
- Maximum relative error: 6.49%.
All twelve outputs were above the reference values. These are historical recall results, not stock forecasts; decimal precision does not imply comparable accuracy.
What changes when the value is in the input?
We repeated the same protocol and added one field to the state:
"closing_level_index_points": "3230.78"The supplied-value control had 0% mean, median, and maximum relative error across twelve runs on the same three values.
This separates two tasks: recalling a number and reading it through a decision interface. The control deliberately provides the answer. It shows that these values can pass through the interval decoder without error at the tested resolution; it does not establish zero error on new questions.
Why intervals instead of digits or bits?
We compared seven interfaces on twelve hand-picked arithmetic problems: six integers and six exact binary fractions. Two option orders and two repeats gave 48 evaluations per method. Every target was nonzero, so relative error was defined throughout.
Mean absolute percentage error:
- Four-way interval decoding: 2.42%.
- Direct choice among 16 values: 3.37%.
- Explicit candidate-set membership: 8.48%.
- Parallel thresholds with monotonic repair: 11.29%.
- Adaptive threshold search: 12.31%.
- Decimal digits with the previous-digit prefix: 15.85%.
- Independent binary bits with explicit instructions: 25.27%.
Interval decoding had the smallest average relative gap in this small suite. It also avoids listing every possible fine-grained value in one question. These results do not establish a universal advantage: the candidate grid, prompts, and particular questions all matter.
A separate follow-up changed both the prompt and the branching factor. Historical recall error rose to 31.17%, while supplied-value readout stayed at 0%. The 4.58% recall result belongs to the recorded ten-way protocol, not every use of the adapter.
From a number to a distribution
One greedy path produces one numerical readout. Our experimental distribution interface instead asks threshold questions, repairs their probabilities into a monotone CDF, and converts that CDF into histogram masses.
There is more work to do here. Raw threshold probabilities were nonmonotone in 25 of 48 arithmetic runs. Repairing the shape does not establish calibration. Likewise, the final interval in point decoding is a resolution interval, not a confidence interval.
Try it
The repository currently requires organization access. With access, run the included stock-price example:
git clone https://github.com/Bring-AI/jev-numeric.git
cd jev-numeric
python -m venv .venv
source .venv/bin/activate
pip install -e .
cp .env.example .env
# Set OPENROUTER_API_KEY in .env.
jev-numeric --request examples/stock-price.json
All reported experiments used typesafe/jev-1.13-20260917 through OpenRouter. The repository includes recorded requests and responses, metric-recomputation scripts, and the original experiment prompts. The reusable adapter uses a general prompt; use the experiment scripts to reproduce the reported protocols.